Marketing attribution models are rules or statistical approaches that assign conversion credit across the touchpoints influencing a buyer's journey. First-touch and last-touch assign all credit to a single touchpoint, whereas linear, time-decay, position-based and W-shaped models distribute it using a fixed rule. Every model addresses a different business question, and none establishes causation. Select the model suited to the decision you must make, then validate it with incrementality tests.
What are marketing attribution models and what business question do they answer?
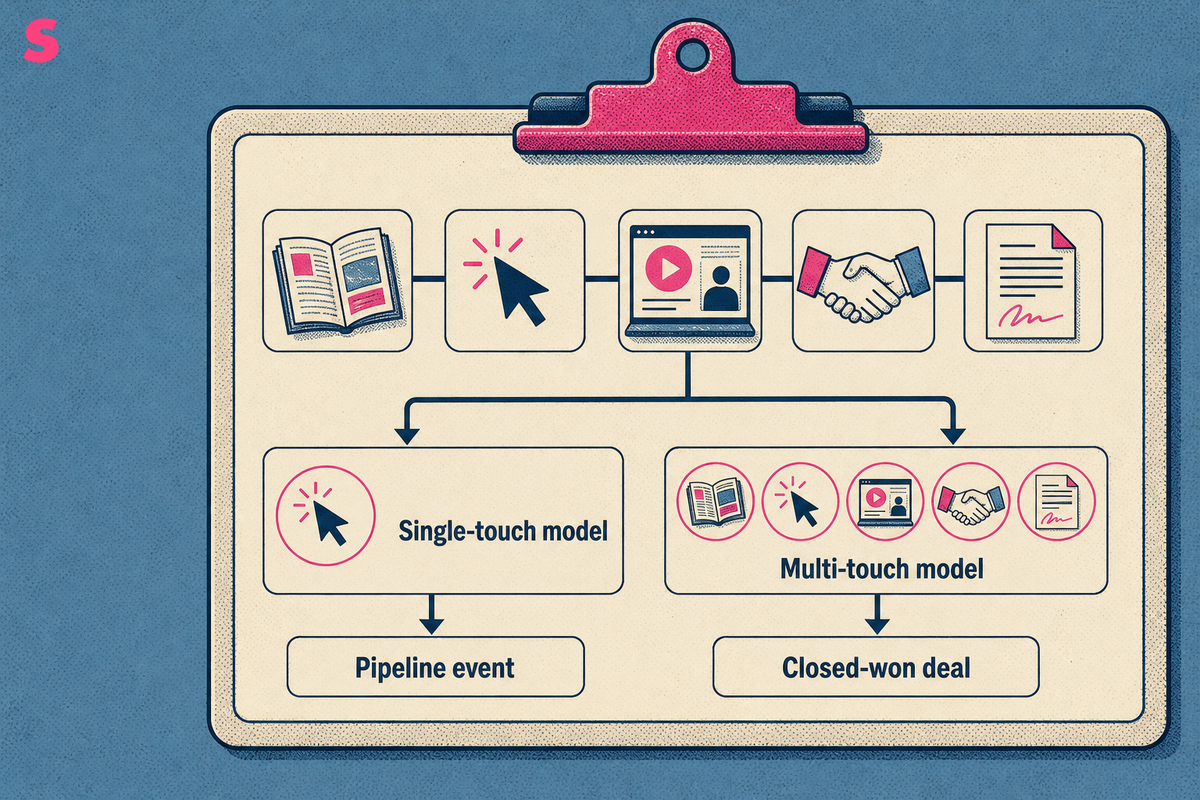
Marketing attribution models are rules for assigning conversion credit across marketing touchpoints. They answer a budget question: which channels, campaigns and interactions receive credit for a pipeline event, purchase or closed-won deal?
An attribution model turns a buyer journey into a reporting view. A buyer may read an article, click a paid ad, attend a webinar, request a demo and later sign a contract. The model determines whether one interaction receives all credit or several interactions share it.
Per Amazon Ads, attribution models fall into two broad categories: single-source models assign all credit to one touchpoint, while multi-touch models distribute credit across several touchpoints. Marketing teams use that distinction to measure discovery, conversion capture or the full buyer journey.
Attribution modelling is not the same as reporting channel revenue. A channel report records activity associated with a channel. An attribution model applies an explicit credit rule across a sequence of interactions. It does not prove that a touchpoint caused the outcome. It makes credit allocation visible and comparable.
What is the difference between single-touch, rules-based and data-driven attribution models?
Single-touch models give all conversion credit to one interaction, rules-based models distribute credit according to a fixed formula, and data-driven attribution uses observed conversion data to calculate a tailored credit pattern. The right category depends on the decision a marketing team needs to make.
First-touch and last-touch attribution are single-touch models. First-touch assigns all credit to the first known interaction, highlighting demand creation. Last-touch assigns all credit to the final recorded interaction, highlighting conversion capture. Both compress a multi-step journey into one event.
- Rules-based attribution: linear, time-decay, U-shaped and W-shaped models use a predefined allocation rule. The visible rule makes reports easier to audit.
- Data-driven attribution: an algorithm uses a property’s own observed data to assign credit across interactions. The output can reflect complex paths, but the scoring logic can be opaque to stakeholders.
- Single-touch attribution: first-touch and last-touch models answer focused questions about acquisition or closing activity rather than the whole journey.
Data-driven attribution does not provide a complete answer by itself. A statistical model can identify patterns in tracked data, yet it inherits the conversion definitions, identity matching and channel data supplied to it. Rules-based attribution provides a counterweight because finance, RevOps and demand generation teams can inspect the formula before relying on the result.
How does one B2B journey score under first-touch, last-touch, linear, time-decay and W-shaped models?
One B2B journey can produce five credit allocations because each attribution model values a different role in the path to conversion. The example below is illustrative, not a recommended formula, and each allocation is configurable.
Consider an invented $100,000 closed-won deal with four recorded touches: a LinkedIn ad, a webinar registration, a pricing-page visit and a demo request. The deal value stays constant. Only the credit rule changes.
- First-touch: the LinkedIn ad receives $100,000 of credit because it introduced the buyer to the brand.
- Last-touch: the demo request receives $100,000 because it was the final recorded interaction before conversion.
- Linear: each of the four touches receives $25,000 because the model splits credit equally.
- Time-decay: an illustrative allocation could assign $10,000 to the ad, $20,000 to the webinar, $30,000 to the pricing page and $40,000 to the demo request.
- W-shaped: an illustrative allocation could assign $30,000 each to the first touch, the webinar as a middle milestone and the final demo request, with $10,000 shared by the remaining touchpoint.
The example shows why a channel can look highly productive in one report and marginal in another. First-touch elevates the ad. Last-touch elevates the demo request. Linear gives every recorded interaction equal standing. W-shaped attribution gives extra weight to defined milestones, so the team must agree which events qualify as meaningful stages.
A model does not discover a universal truth about the deal. It makes a declared judgment about credit allocation. The useful question is whether that judgment matches the budget decision under review.
When is a position-based attribution model more useful than a linear one?
A position-based attribution model is more useful than a linear model when specific journey milestones matter more than ordinary interactions. Linear attribution treats every recorded touch equally, while position-based rules give extra credit to entry, conversion or qualification events.
U-shaped and W-shaped models are common position-based formats. A U-shaped model emphasizes the first interaction and a defined conversion point. A W-shaped model emphasizes the first touch, a middle milestone and the final conversion, while other touches share the remaining credit.
Position-based attribution works well when a B2B team has reliable stage definitions, such as first engagement, qualified lead and opportunity creation. These stages often correspond to handoffs between demand generation, sales development and account executives. The report can show whether channels contribute at each named handoff.
Linear attribution is stronger when a team wants a neutral baseline across a long journey and does not trust its stage taxonomy. Its simplicity prevents debates about why one webinar, meeting or page view qualifies for extra weight. Its weakness is equal treatment: a passing display impression receives the same credit as a deliberate demo request when both count as touches.
Which attribution model is best for understanding which marketing channels drive conversions?
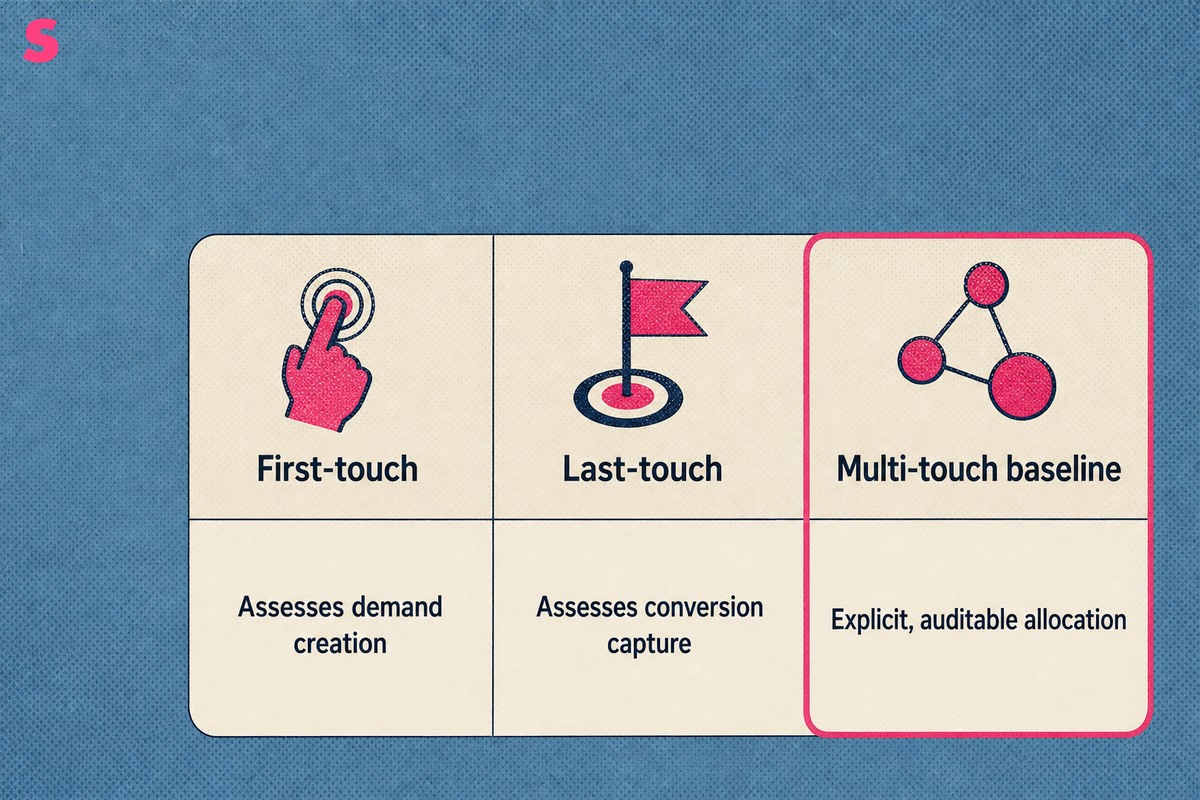
No single attribution model is best for every channel decision. Use a transparent multi-touch baseline, then compare it with data-driven attribution when conversion volume and clean identity data support the analysis. The comparison shows whether a budget conclusion survives different credit rules.
For most marketing teams, linear or position-based attribution provides a clear starting point because the allocation is explicit. First-touch assesses demand creation. Last-touch assesses conversion capture. Data-driven attribution can surface patterns beyond a fixed rule, but its output needs documentation covering the conversion event, lookback window and included channels.
Attribution models can reward channels that are easy to track. Paid search, retargeting and branded email often generate identifiable clicks close to conversion. Dark social, untagged referrals, offline conversations and AI-referred research can receive too little credit when they do not produce a measurable touchpoint.
Counter that bias with a reporting protocol rather than a single model. Compare first-touch, last-touch and a multi-touch view; reconcile self-reported source data with click data; and review results at account and opportunity level before reallocating budget. A channel should earn investment when its contribution remains credible across the measurement design.
How does stage-weighted credit differ from last-click attribution?
Stage-weighted credit assigns value according to movement through a buyer journey, while last-click attribution gives all credit to the final recorded interaction before conversion. Stage weighting asks which touch advanced the account. Last click asks which touch appeared last.
Last-click attribution is useful for analyzing immediate conversion capture, especially when a team needs to understand the final path into a form submission or purchase. Its structural limitation is that it assigns no credit to earlier activity that created awareness, built preference or moved an account toward evaluation.
Sona Marketing Measurement is built AI-native, with AI search treated as a first-class channel in the same identity graph as paid, content, email and sales. Sona resolves anonymous and known traffic into account and contact profiles, then weights attribution credit by stage transition rather than last click. AI-referred visits can sit within the buyer journey rather than being reduced to unclassified direct traffic.
Stage-weighted attribution requires disciplined lifecycle definitions. Teams need to specify the events that count as movement, such as an identified account visit, a qualified lead, an opportunity or a closed-won deal. Weak stage definitions produce weak weighting, regardless of the sophistication of the credit rule.
The useful question is not merely which channel appeared before conversion. It is which sequence of interactions moved the buyer through meaningful stages and into revenue.
Which attribution model fits e-commerce, B2B, SaaS and agency teams?
Different attribution models fit different operating contexts because conversion cycles, conversion events and reporting requirements vary by business model. The table compares practical starting points, not permanent model selections.
| Team scenario | Model that tends to fit | What it can answer | Main weakness |
|---|---|---|---|
| E-commerce | Last-touch plus time-decay | Which campaign or promotion preceded a purchase within a short path | Early discovery receives less credit when purchase activity concentrates near checkout |
| B2B | W-shaped or stage-weighted multi-touch | Which channels contributed to 3 key stages: first engagement, qualification and opportunity | Results rely on consistent CRM stages and identity matching across stakeholders |
| Subscription or SaaS | First-touch plus multi-touch comparison | Which acquisition sources introduce accounts and which touches support trial-to-paid conversion | A 1-account view can obscure product usage by several contacts |
| Agencies | Linear baseline with client-specific position-based rules | How 2 reporting views change campaign credit for each client | Cross-client comparisons become difficult when conversion definitions differ |
B2B teams benefit from models that recognize account progression because several people can influence one deal. Subscription teams need to distinguish acquisition from expansion and retention. Agencies need a documented model per client, particularly when reporting combines paid media, content, CRM outcomes and client-owned sales activity.
The model should follow the decision cadence. A weekly paid-media optimization decision can use a narrower window than a quarterly pipeline planning decision. Both reports can be valid when they state their conversion definition and credit rule.
Why do attribution results differ from CRM, ad platform and finance revenue?
Attribution results differ from CRM, ad platform and finance revenue because each system uses different identities, timestamps, conversion definitions and lookback windows. A discrepancy is not automatically an error. It often reflects different rules applied to the same commercial activity.
An ad platform can credit a conversion after an ad interaction under its own attribution window. A CRM can associate revenue with an opportunity creation date, a lead source or a contact record. Finance can recognize revenue according to invoicing or contractual rules. Each answer serves a different operational purpose.
- Identity: one buyer can use several devices, email addresses and channels before becoming a known CRM contact.
- Timestamp: a platform can record click time, a CRM can record opportunity creation and finance can record booked revenue.
- Conversion definition: a form fill, qualified lead, opportunity and paid invoice are distinct events.
- Data coverage: consent loss, offline activity, missing UTMs and siloed data create gaps in the recorded path.
Identity resolution reduces fragmentation by connecting anonymous and known activity where data is available. It does not eliminate the underlying boundary. Per Wikipedia, attribution models assign credit from observational and correlational data rather than establishing causality. Revenue reports need reconciliation rules, not an expectation that every system will match exactly.
When should marketers use attribution, incrementality testing, marketing mix modeling or a combination?
Marketers should use attribution for journey-level credit, incrementality testing for causal lift and marketing mix modeling for broad channel investment decisions. A combination works best when the organization needs operational optimization and evidence about whether spend created incremental outcomes.
Per Digital Applied, November 2026, 76% of U.S. buy-side decision-makers reported using incrementality tests, 73% used attribution analysis and 67% used marketing mix modeling. Only 39% used all three methods together. Each method answers a different question.
- Attribution: Which recorded touchpoints received credit for a conversion or revenue event?
- Incrementality testing: Did a channel or campaign create lift beyond what would have happened without it?
- Marketing mix modeling: How do aggregate media inputs relate to aggregate business outcomes over time?
Attribution diagnoses account journeys, campaign sequences and conversion paths. Incrementality tests support decisions that require a counterfactual, such as whether a retargeting audience or regional campaign drove additional demand. Marketing mix modeling supports budget planning across channels when granular user-level tracking is incomplete.
A practical measurement program uses attribution to form a hypothesis, incrementality testing to test causal lift and marketing mix modeling to guide portfolio allocation. The methods should disagree at times. Those disagreements reveal where tracking coverage, model assumptions or channel interactions need closer review.
Frequently Asked Questions
Which attribution models does Google Analytics 4 still support?
Per Google’s support documentation, November 2023, first-click, linear, time-decay and position-based models were removed from Google Analytics 4. The remaining choices are data-driven and last-click attribution. Google Ads supports the same two choices, so rules-based comparisons need to happen outside those tools.
What is a linear attribution model?
A linear attribution model splits conversion credit equally across every touchpoint in the recorded journey. It provides a neutral multi-touch baseline and is simple to run with basic tools. Its trade-off is equal weighting: a passing ad view receives the same credit as a high-intent demo request.
What is the difference between first-touch and last-touch attribution?
First-touch attribution gives all credit to the first interaction, while last-touch attribution gives all credit to the final interaction before conversion. Both are single-source models. First-touch rewards discovery channels, and last-touch rewards channels that capture or close demand.
What is a time-decay attribution model?
A time-decay attribution model gives more credit to touchpoints closer to conversion and less credit to earlier interactions. It fits shorter, promotion-driven cycles where recent activity carries strong decision value. It can under-credit early demand creation in longer B2B journeys.
Do attribution models prove that a marketing channel caused a sale?
No. Per Wikipedia, attribution models assign credit through observational, correlational data and do not establish causality. Incrementality testing provides causal evidence by comparing outcomes against a counterfactual, such as a holdout group or controlled experiment.
How do you start implementing an attribution model?
Start with a short sequence:
- Define the conversion event and the budget decision it will inform.
- Connect website, ad platform and CRM data around consistent campaign and identity fields.
- Run one transparent model as a baseline, such as linear or last-touch.
- Compare the baseline with a second model before moving budget.
- Document the lookback window, conversion definition and exclusions in every report.
Summarize this article with AI: ChatGPT · Claude · Perplexity · Google AI Mode
Last updated: November 2026