Supercharge your lead generation with a FREE Google Ads audit - no strings attached! See how you can generate more and higher quality leads
Get My Free Google Ads AuditFree consultation

No commitment
Supercharge your lead generation with a FREE LinkedIn Ads audit - no strings attached! See how you can generate more and higher quality leads
Get My Free Google Ads AuditFree consultation
No commitment
Supercharge your lead generation with a FREE Meta Ads audit - no strings attached! See how you can generate more and higher quality leads
Get My Free Google Ads AuditGet My Free LinkedIn Ads AuditGet My Free Meta Ads AuditFree consultation
No commitment

"Really, really impressed with how we're able to get this amazing data ...and action it based upon what that person did is just really incredible."


"The Sona Revenue Growth Platform has been instrumental in the growth of Collective. The dashboard is our source of truth for CAC and is a key tool in helping us plan our marketing strategy."

"The Sona Revenue Growth Platform has been fantastic. With advanced attribution, we’ve been able to better understand our lead source data which has subsequently allowed us to make smarter marketing decisions."


Supercharge your lead generation with a FREE Google Ads audit - no strings attached! See how you can generate more and higher quality leads
Get My Free Google Ads AuditFree consultation
No commitment
Engagement rate is one of the simplest ways to judge if your marketing is resonating. A “good” engagement rate depends on platform, industry, and audience size, but most marketers consider 1 to 5 percent solid for social and higher for smaller, niche audiences. This guide defines engagement rate, shows how to interpret it across channels, and gives realistic benchmarks you can use to set targets. For additional context, you can also compare these ranges with industry benchmarks.
Engagement rate is the share of people who interact with your content (likes, comments, clicks, etc.) out of everyone who saw it. For most social channels, 1–5% is considered solid in the US and Europe. Judge “good” by trends over time, how you compare to competitors, and whether engagement leads to clicks and conversions.
Engagement rate is the percentage of people who interact with your content out of the total people who saw it or could have seen it. It captures likes, comments, shares, saves, clicks, and other interactions that signal attention or interest. If you need a deeper KPI breakdown with formulas, this engagement rate overview is a helpful reference.
In marketing, engagement rate is used to judge content relevance, creative quality, and audience fit across social media, email, websites, and ads. A high engagement rate usually signals that your message matches audience intent; a low rate flags misalignment in targeting, creative, or offer.
You will see engagement rate in:
For example, at Sona, we use engagement rate across LinkedIn thought leadership posts to see which topics drive comments from target accounts. Posts with high engagement from qualified companies move into paid amplification, while low engagement posts are retired or reworked.
A “good” engagement rate is one that outperforms relevant peers: same platform, similar audience size, similar industry, identical objective. Community conversations, like this Reddit thread on good engagement rates, can also help you sanity check expectations against what other practitioners see.
Broad directional rules:
Single data points are less useful than trends. A “good” engagement rate for you is:
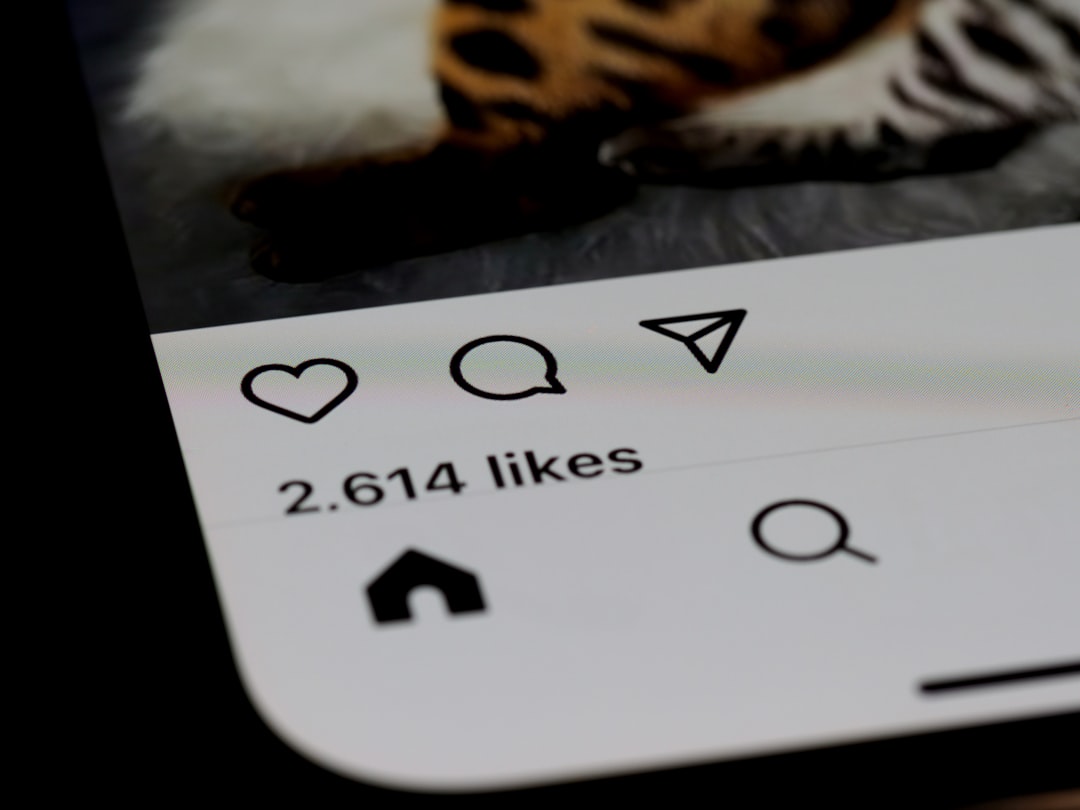
Engagement behavior is platform specific. Short form video and personal LinkedIn profiles routinely outperform brand Facebook pages or display ads. For channel-level nuance, especially on Instagram, you can cross-check against Sprout Social’s Instagram engagement guide.
Use these as directional ranges for organic content in 2025–2026. Paid placements usually sit slightly lower on engagement rate but higher on reach and conversions.
| Platform | Average Engagement Rate | Good Engagement Rate | Top Performer Engagement Rate | Notes (Organic vs Paid) |
| Instagram feed | 0.5% – 1.5% | 1.5% – 3% | 3% – 6% | Organic usually higher than paid |
| Instagram Reels | 1.5% – 4% | 4% – 8% | 8%+ | Video and carousels outperform single images |
| LinkedIn pages | 1% – 2% | 2% – 4% | 4% – 7% | B2B audiences, low volume but high value |
| LinkedIn personal profiles | 2% – 5% | 5% – 10% | 10%+ | Thought leadership and narrative posts overperform |
| TikTok | 3% – 6% | 6% – 12% | 12%+ | Strong creative can spike far above average |
| Facebook pages | 0.2% – 0.9% | 0.9% – 2% | 2% – 4% | Organic reach is limited; paid support common |
| X (Twitter) | 0.3% – 1% | 1% – 3% | 3% – 5% | Replies and quote posts drive higher engagement |
| YouTube videos | 0.5% – 2% | 2% – 5% | 5%+ | Comments and likes matter, but watch time is critical |
| 0.2% – 1% | 1% – 3% | 3% – 5% | Clicks and saves drive downstream value |
Platform benchmarks shift by content type. On Instagram, Reels and carousels usually deliver higher engagement rates than static posts; on YouTube, Shorts outperform long form if you judge only likes and comments, but full videos may win on watch time and conversions.
Industry norms and audience size have a major impact on what is realistic.
Approximate organic social benchmarks across major industries:
| Industry | Average Engagement Rate | Good Engagement Rate | Top Quartile Engagement Rate | Typical Primary Channel |
| SaaS / B2B Software | 1% – 2% | 2% – 4% | 4% – 6% | |
| Professional Services | 0.8% – 1.5% | 1.5% – 3% | 3% – 5% | LinkedIn, email |
| Ecommerce / Retail | 0.7% – 1.5% | 1.5% – 3% | 3% – 6% | Instagram, TikTok |
| Consumer Apps | 1% – 2% | 2% – 5% | 5% – 8% | TikTok, YouTube |
| Financial Services | 0.5% – 1.2% | 1.2% – 2.5% | 2.5% – 4% | LinkedIn, Facebook |
| Healthcare | 0.5% – 1.2% | 1.2% – 2.5% | 2.5% – 4% | Facebook, LinkedIn |
| Manufacturing / Industrial | 0.4% – 1% | 1% – 2% | 2% – 3.5% | |
| Education / Nonprofit | 1% – 2% | 2% – 4% | 4% – 7% | Facebook, Instagram |
Industry engagement also varies by funnel stage. Awareness campaigns typically trade a bit of engagement rate for reach; consideration and conversion campaigns may show lower engagement rate but better quality interactions that convert later, especially when you track offline conversions like calls or in person demos. Platforms like Sona help you link engagement rate improvements to those offline events so you get a complete ROI picture instead of undervaluing channels that drive human conversations. Sona is an AI-powered marketing platform that turns first-party data into revenue through automated attribution, data activation, and workflow orchestration; if you want to see how that works in practice, you can book a Sona demo.
On Instagram, engagement rate declines consistently as accounts grow. Benchmarks below use engagement rate per post by followers.
| Follower Band | Average Engagement Rate | Good Engagement Rate | Notes |
| 0 – 1,000 | 4% – 8% | 8% – 12% | Tight communities, high relevance |
| 1,001 – 10,000 | 2.5% – 5% | 5% – 8% | Strong growth and visibility |
| 10,001 – 50,000 | 1.5% – 3% | 3% – 5% | Content discipline matters |
| 50,001 – 250,000 | 0.8% – 2% | 2% – 3.5% | More casual followers, higher noise |
| 250,001+ | 0.3% – 1% | 1% – 2% | Scale prioritised over depth |
Larger accounts should not chase small account percentages. Instead, compare performance within your follower band and focus on segments that show high intent engagement, such as saves, shares, and clicks that lead to high value page visits.
Beyond social, you should calibrate what “good” means for email, web, and ads.
| Channel | Primary Engagement Actions | Typical Average Engagement Rate | Good Engagement Rate | Metric Definition |
| Organic social | Likes, comments, shares, saves, clicks | 0.5% – 2% | 2% – 5% | Engaged users ÷ reach or impressions |
| Paid social | Clicks, video views, reactions, shares | 0.3% – 1.5% | 1.5% – 3% | Engagements ÷ impressions |
| Opens, clicks, replies | 15% – 25% open, 1.5% – 3% click | 25%+ open, 3% – 6% click | Unique opens or clicks ÷ delivered emails | |
| Website (GA4) | Engaged sessions: scroll, time, conversions | 45% – 60% | 60% – 75% | Engaged sessions ÷ total sessions |
| Display ads | Clicks, hover interactions, rich media events | 0.05% – 0.2% | 0.2% – 0.5% | Engagements ÷ impressions |
| Video ads | Thruplays, video views, clicks | 1% – 5% | 5% – 10% | Engagements ÷ impressions or views |
| Communities | Posts, replies, reactions | 5% – 15% | 15% – 30% | Active participants ÷ total members |
In GA4, engagement rate is defined as the percentage of sessions that last longer than 10 seconds, contain 1 or more conversion events, or have 2 or more page views or screen views. A “good” GA4 engagement rate is typically 60 percent or higher for content rich properties, lower for single page tools or calculators.
Engagement rate is a leading indicator of content resonance and a supporting signal of future pipeline and revenue. It matters because it connects:
Engagement rate also influences how algorithms treat your content. Platforms reward posts with strong early engagement by expanding reach, which creates a flywheel effect that reduces effective CPM and CPC. In paid media, high engagement can improve relevancy or quality scores, which lowers cost per engagement and sometimes cost per conversion.
Critically, engagement rate should not exist in a silo. At Sona, we map engagement to stages in the funnel, including offline events like calls, demos, and field meetings. That lets you see whether a high engagement audience is actually driving pipeline and customer lifetime value, giving you a complete ROI picture instead of optimising purely for clicks or likes. If you want to go deeper on measurement, Sona’s blog post Measuring Marketing’s Influence explains how to connect engagement to pipeline impact.
Misunderstanding what engagement rate can and cannot tell you leads to poor decisions. Several myths come up repeatedly.
Treat engagement rate as a directional gauge, not the final scorecard.
Improving engagement rate is about better audience fit, sharper creative, and cleaner distribution. You can lift engagement both organically and in paid campaigns without sacrificing quality.
Experimentation is essential. A simple testing backlog with hypotheses, expected impact, and effort level will keep teams focused. For instance, moving from generic campaigns to segmented campaigns often produces moderate effort but high impact on engagement rate and revenue.
Most marketing platforms report some version of engagement rate natively:
Operationally, review engagement rate:
To avoid fragmented and inconsistent views, many teams centralise engagement rate in Sona. Sona pulls engagement metrics across social, email, web, and ads, aligns definitions, and connects them with pipeline and revenue data. You can segment by audience, creative, and funnel stage, see where engagement is actually turning into opportunity, and forecast where to allocate budget next quarter. If your goal is to uncover and act on the highest-intent audiences behind those engagements, Sona’s use case on identifying new leads shows how to turn engaged traffic into pipeline.
Tracking engagement rate in context of these related metrics gives you a balanced view: one that values attention and interaction, but only when they contribute meaningfully to business growth. When you are ready to connect those signals to actual revenue and see which channels truly drive pipeline, you can explore Sona’s workflow in more depth by requesting a Sona demo.
Understanding and consistently tracking engagement rate empowers marketing analysts, growth marketers, CMOs, and data teams to make data-driven decisions that elevate campaign performance. Mastering this vital KPI means you can optimize your messaging, allocate budgets more efficiently, and measure success with precision—turning raw interactions into clear insights that fuel sustainable growth.
Imagine having real-time visibility into exactly which campaigns and channels spark the highest engagement, allowing you to shift resources instantly to maximize ROI. With Sona.com’s intelligent attribution, automated reporting, and cross-channel analytics, you gain the tools to transform engagement metrics into actionable strategies that drive measurable results.
Start your free trial with Sona.com today and unlock the full potential of your marketing data to fuel smarter decisions and unstoppable momentum.
A good engagement rate varies by platform, industry, and audience size, but generally ranges from 1 to 5 percent for social media, with higher rates for smaller, niche audiences.
Engagement rate is calculated as the percentage of people who interact with your content out of the total who saw or could have seen it, including likes, comments, shares, saves, and clicks.
B2B companies, especially in SaaS or professional services, typically aim for 1 to 2 percent average engagement, with good engagement rates between 2 to 4 percent and top performers reaching 4 to 6 percent.
Yes, engagement rates differ by platform and industry; for example, TikTok and Instagram Reels often have higher rates than Facebook pages, and industries like consumer apps usually see higher engagement than financial services.
Factors include platform, audience size, industry, content type, and campaign objectives. Engagement rates should be compared to your 90-day averages, competitors, and supported by downstream metrics like click-through and conversion rates.
Improve engagement by tailoring audience segments, optimizing content formats per platform, using strong hooks and clear CTAs, testing posting cadence, and fostering conversations through replies and user-generated content.
Engagement rate indicates how well your content resonates, influencing brand awareness, consideration, and downstream efficiency like click-through and conversion rates, which ultimately impact pipeline and revenue.
Track engagement rate using native metrics on social platforms, email service providers, GA4 for web, and ad platforms. Review frequently—daily for paid campaigns, weekly for organic—to maintain consistent and actionable insights.
Not always; a high engagement rate with low-quality interactions may be less valuable than lower engagement that drives qualified leads and conversions. Focus on engagement linked to business goals.
Engagement rate usually declines as follower count grows; small accounts (0–1,000 followers) often see 4 to 8 percent average rates, while large accounts (250,000+ followers) may have averages between 0.3 to 1 percent.
"Really, really impressed with how we're able to get this amazing data ...and action it based upon what that person did is just really incredible."
"The Sona Revenue Growth Platform has been instrumental in the growth of Collective. The dashboard is our source of truth for CAC and is a key tool in helping us plan our marketing strategy."
"The Sona Revenue Growth Platform has been fantastic. With advanced attribution, we’ve been able to better understand our lead source data which has subsequently allowed us to make smarter marketing decisions."
Join results-focused teams combining Sona Platform automation with advanced Google Ads strategies to scale lead generation

Connect your existing CRM
Free Account Enrichment
No setup fees
No commitment required
Free consultation
Get a custom Google Ads roadmap for your business
Join results-focused teams combining Sona Platform automation with advanced Meta Ads strategies to scale lead generation
Connect your existing CRM
Free Account Enrichment
No setup fees
No commitment required
Free consultation
Get a custom Google Ads roadmap for your business
Join results-focused teams combining Sona Platform automation with advanced LinkedIn Ads strategies to scale lead generation
Connect your existing CRM
Free Account Enrichment
No setup fees
No commitment required
Free consultation
Get a custom Google Ads roadmap for your business
Join results-focused teams using Sona Platform automation to activate unified sales and marketing data, maximize ROI on marketing investments, and drive measurable growth
Connect your existing CRM
Free Account Enrichment
No setup fees
No commitment required
Free consultation
Get a custom Google Ads roadmap for your business
Over 500+ auto detailing businesses trust our platform to grow their revenue
Our team of experts can implement your Google Ads campaigns, then show you how Sona helps you manage exceptional campaign performance and sales.
Schedule your FREE 15-minute strategy sessionOur team of experts can implement your Meta Ads campaigns, then show you how Sona helps you manage exceptional campaign performance and sales.
Schedule your FREE 15-minute strategy sessionOur team of experts can implement your LinkedIn Ads campaigns, then show you how Sona helps you manage exceptional campaign performance and sales.
Schedule your FREE 15-minute strategy sessionOur team of experts can help improve your demand generation strategy, and can show you how advanced attribution and data activation can help you realize more opportunities and improve sales performance.
Schedule your FREE 30-minute strategy sessionOur team of experts can help improve your demand generation strategy, and can show you how advanced attribution and data activation can help you realize more opportunities and improve sales performance.
Schedule your FREE 30-minute strategy sessionOur team of experts can help improve your demand generation strategy, and can show you how advanced attribution and data activation can help you realize more opportunities and improve sales performance.
Schedule your FREE 30-minute strategy sessionOur team of experts can help improve your demand generation strategy, and can show you how advanced attribution and data activation can help you realize more opportunities and improve sales performance.
Schedule your FREE 30-minute strategy session


By continuing, I confirm that I’ve read and accept the Sona Master Services Agreement, Terms and Conditions and the Privacy Policy.


Launch campaigns that generate qualified leads in 30 days or less.


