To tie AI visibility gains to revenue, monitor a fixed group of buyer prompts, connect every AI-referred visit to a CRM account, and compare pipeline between accounts exposed to the improvement and those not exposed. Establish the baseline before altering anything, and regard the outcome as influenced pipeline until a controlled test proves more. Most tools end at mention totals; Sona AI Visibility links citations and prompts to pipeline and revenue within a single account timeline.
What do you need in place before connecting AI visibility to revenue?
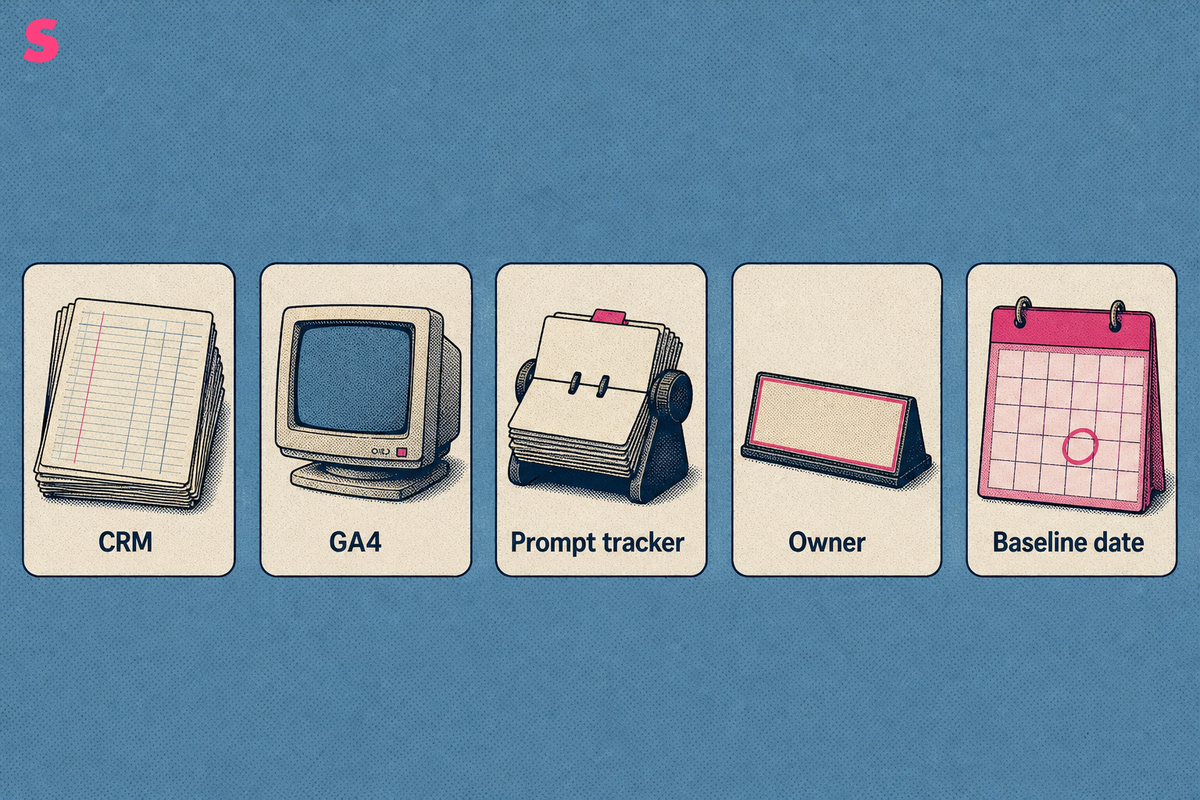
To connect AI visibility improvements to revenue, track a fixed prompt set, link AI-referred visits to accounts, and compare pipeline against a baseline. The system needs a CRM with opportunity stages, GA4, a prompt tracker, a named owner, and a baseline date before reporting begins.
GA4 captures referral and behavioral data, the CRM holds accounts, opportunities, and closed revenue, and a BI layer can join those records into a revenue view. AI visibility tools should integrate with GA4, CRM, and BI tools to demonstrate revenue impact from visibility improvements, per nicklafferty.com.
- CRM: Defined lifecycle stages, opportunity values, close dates and closed-won status.
- GA4: AI referral-source rules, campaign conventions and conversion events.
- Prompt tracker: A stable prompt cohort mapped to buyer intent and buying stages.
- Owner: One marketing or RevOps lead responsible for data quality and review cadence.
- Baseline date: A documented starting range for visibility, referrals, pipeline and win rate.
Sona AI Visibility supports the measurement layer by connecting AI citations and AI-referred visits to pipeline and revenue. The operating model still requires clean CRM records and consistent source capture.
How does AI visibility influence each stage of the B2B SaaS buyer journey?
AI visibility affects the B2B SaaS buyer journey before a buyer reaches a website, then shapes which vendors enter the shortlist. AI gives buyers faster access to competitive intelligence, pricing comparisons, ROI analysis, and vendor information, per ey.com.
- Category discovery: Buyers ask educational questions about a problem, workflow or market category. This stage tends to create branded demand and direct traffic rather than immediate pipeline.
- Vendor shortlisting: Buyers ask which vendors support a use case, industry or integration. A citation here can create identifiable account research and early-stage opportunities.
- Comparison and pricing research: Buyers evaluate trade-offs, implementation requirements and commercial fit. This stage is most likely to correlate with qualified pipeline.
- Purchase: Buyers seek a demo, trial, pricing detail or procurement answer. This stage should appear in CRM conversion paths, opportunity progression and closed revenue.
B2B SaaS measurement needs account-level context because buying committees research at different times and through different prompts. One person may ask a category question, another may compare vendors, and a third may visit a pricing page. Revenue attribution must join those signals at the account level.
B2C ecommerce follows the same visibility-to-action logic, but the path is shorter. Product discovery, comparison, and purchase often happen in one session, so direct order value and conversion events matter more than long-cycle influenced pipeline.
How do you build a buyer prompt set and record a baseline?
Build a buyer prompt set by mapping real buyer questions to buying stage, use case, industry, and competitive context, then run that cohort daily from a recorded baseline date. A prompt list should represent meaningful coverage, not raw volume.
- List core use cases, industries, product categories and competitor comparisons.
- Assign every prompt to awareness, consideration, decision or purchase.
- Tag prompts by commercial importance, target account fit and owning team.
- Freeze the cohort for the reporting period, including wording, location and answer engines.
- Run the cohort daily and record visibility, citations, source domains, sentiment and referral outcomes as ranges.
AI answers vary, but they remain measurable when teams run the same prompt list consistently. Daily runs reveal patterns that weekly snapshots can obscure. Retrieval indexes, model updates, and new competitor content can change a single response. Teams should distinguish persistent movement across repeated runs from isolated spikes, then define a trend threshold before analysis based on their own baseline variability.
Organic ranking is not a sufficient AI visibility baseline. Google AI Overviews can cite domains beyond Google's organic top 10, so Google AI Overviews require their own prompt and citation baseline.
Sona AI Visibility records prompts, citations and AI-referred activity over time, creating a comparable series rather than a dated score. The baseline should include a range because a single answer is only one observation.
Which AI visibility metrics move with pipeline and revenue?
The AI visibility metrics that matter show brand influence, competitive position, and revenue correlation. Mentions, citations, and share of voice are leading indicators. CRM pipeline, win rate, and closed revenue are lagging indicators.
Sentiment explains what AI answers say about a brand, while business metrics connect visibility to commercial outcomes. A sound measurement model separates these signals rather than treating citation volume as revenue proof.
| Metric | What it measures | B2B SaaS revenue outcome | B2C ecommerce revenue outcome | Enterprise revenue outcome |
|---|---|---|---|---|
| Mentions and citations | Brand inclusion in answers from a fixed prompt set | Branded demand and early account research | Product discovery and category consideration | Account awareness across buying committees |
| Share of voice | Relative brand presence against competitors | Shortlist entry and influenced pipeline | Category preference and product-page visits | Competitive position within target accounts |
| Sentiment and answer framing | How AI describes positioning, strengths and objections | Opportunity quality and sales objections | Conversion rate and return risk | Procurement confidence and stakeholder alignment |
| AI referral traffic | Visits arriving after AI-assisted research | Demo requests and account creation | Product views, carts and orders | Known-account engagement and opportunity creation |
| Pipeline and win rate | Commercial progression after AI-influenced research | Influenced pipeline and closed-won revenue | Revenue per session and repeat purchase | Opportunity value, stage progression and deal velocity |
Use leading metrics to prioritize content and technical work. Use lagging metrics to assess commercial outcomes. A higher citation count without account progression is evidence of visibility, not return.
How do you connect AI answers and referral traffic to CRM accounts and closed revenue?
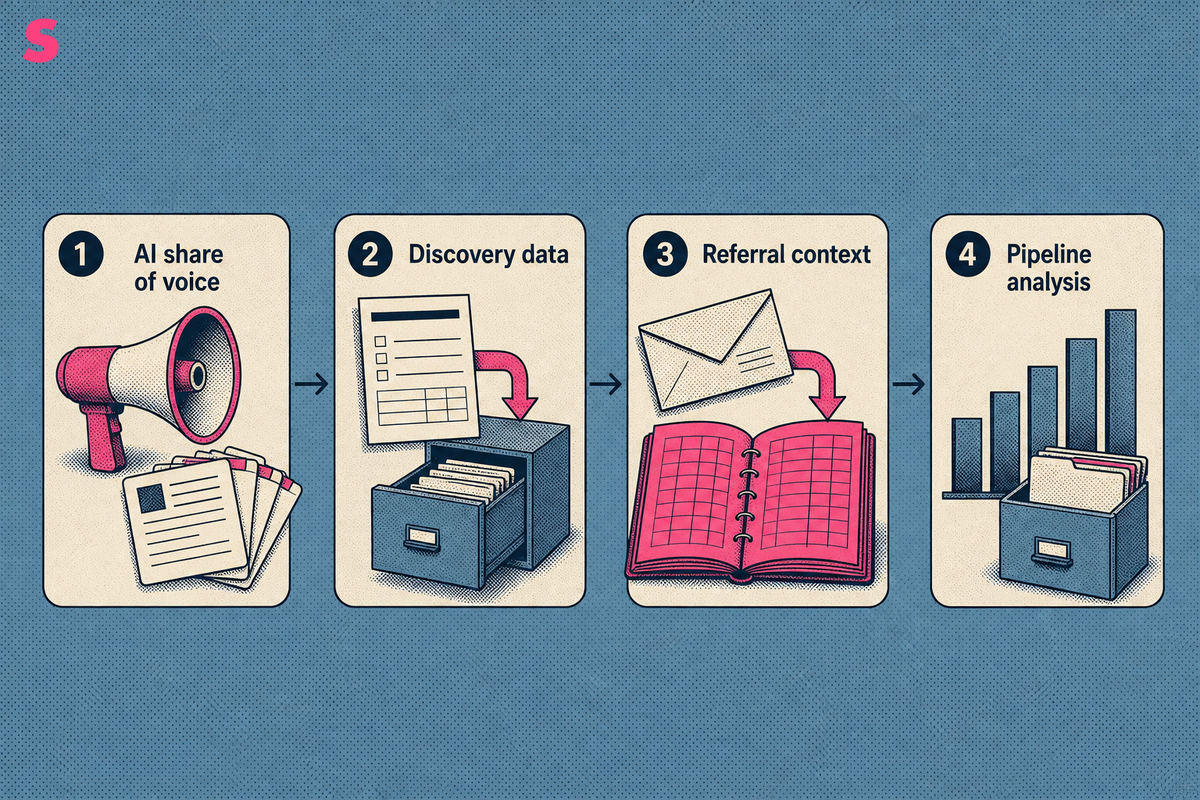
Connect AI answers to closed revenue through three linked methods: AI share of voice, CRM attribution, and pipeline analysis. Each method answers a different question. Together, they show whether visibility influenced revenue.
- Measure AI share of voice: Track brand mentions, citations, sources and competitive position across the frozen prompt cohort.
- Capture discovery data: Add AI assistants and answer engines to demo, trial and contact-form intake fields. Include an open text field for buyers whose research created no referral click.
- Pass referral context: Send AI referral source, landing page, campaign data and conversion event data from GA4 into the CRM.
- Analyze pipeline: Join account activity, opportunity creation, stage progression, win rate and closed revenue against AI-influenced cohorts.
Report the result as influenced pipeline until a holdout or controlled test supports a causal claim. A useful control compares accounts exposed to content or pages improved for a prompt cohort with comparable accounts outside that cohort. Correlation is operationally useful, but it is not proof.
Sona AI Visibility provides company-level visitor identification and AI search attribution, with page-level insights and Agent Analytics available on Growth.
AI share of voice shows whether a brand appeared. CRM attribution shows which accounts arrived. Pipeline analysis shows whether those accounts advanced. Together, these methods connect AI visibility improvements to revenue.
How do marketing, SEO, content, product marketing and sales teams act on AI visibility data?
AI visibility data becomes useful when each team owns a specific response, from prompt governance through CRM hygiene. Sending sales a citation report is not an operating model.
- SEO and content: Own prompt gaps, cited-page improvements, comparison content and source-quality analysis.
- Product marketing: Own positioning accuracy, competitor framing, use-case coverage and pricing research content.
- Demand generation: Own campaign alignment, audience activation and conversion paths from AI-referred visits.
- Sales: Own discovery questions, objection patterns and feedback on which AI-influenced accounts progress.
- RevOps: Own source normalization, account matching, lifecycle definitions and CRM completeness.
Rank work by expected revenue impact, not raw mention volume. A missing citation for a decision-stage prompt from an ICP account matters more than a weak position on a broad awareness prompt. Use buying stage, account fit, and gap size to set priorities.
Run prompts daily, review opportunities and referral quality weekly, and conduct positioning and competitive benchmark reviews monthly or quarterly. Sona AI Visibility can help teams relate prompt coverage to pipeline, but the operating rhythm depends on shared ownership across marketing and sales.
At what point does AI visibility revenue impact justify the cost of tracking it?
AI visibility tracking justifies its cost when incremental closed revenue or contribution profit covers total software, labor, and implementation cost. Compare coverage, data quality, attributable revenue, and contribution margin, not subscription price alone.
Calculate break-even in four steps. First, total monthly software, labor, and implementation costs. Second, divide total cost by contribution margin to calculate required incremental closed revenue, or compare total cost directly with required incremental contribution profit. Third, calculate expected revenue per AI-influenced opportunity as average deal value multiplied by win rate and attribution weighting. Fourth, divide required incremental closed revenue by expected revenue per AI-influenced opportunity to determine the additional qualified opportunities required for break-even.
Map the required opportunity count back to the observed lift in commercially weighted visibility or AI-influenced accounts. There is no universal mention or share-of-voice percentage for break-even. Each company derives its threshold from its own economics, baseline conversion data, and commercially relevant prompt cohort.
| Worksheet input | Variable | How to calculate it | Decision use |
|---|---|---|---|
| Tracking subscription | Subscription cost | Monthly software and data costs | Sets the fixed measurement cost |
| Team effort | Hours × internal cost | Prompt governance, analysis, content and CRM work | Shows the full operating cost |
| AI-influenced opportunities | Qualified opportunity count | Accounts with AI referral or self-reported AI discovery | Tests whether visibility reaches sales activity |
| Average deal value | Average contract value | CRM opportunity value for the measured cohort | Translates opportunity movement into commercial value |
| Win rate | Closed-won opportunities ÷ opportunities | Compare AI-influenced and holdout cohorts | Estimates expected closed revenue |
| Sales-cycle length | Days to close | Measure from opportunity creation to closed-won | Sets the period before judging return |
Early-stage companies should limit investment to a narrow, high-intent prompt set until CRM capture is reliable. Mid-market teams should expand when AI-influenced accounts create qualified opportunities. Enterprise teams with large deal values can justify broader coverage once account-level linkage reveals committee activity. Sona AI Visibility should be assessed against measurable pipeline value rather than visibility volume alone.
What does it look like when AI visibility is working for revenue?
AI visibility is working for revenue when a stable prompt cohort shows improving share of voice, AI-referred accounts appear in the CRM at meaningful buying stages, and influenced pipeline rises against a holdout. Success is a connected trend, not an isolated citation increase.
A practical monitoring view includes prompt-level visibility ranges, source domains, AI referral sessions, identified accounts, self-reported discovery, opportunity stage, pipeline value, win rate, and closed revenue. Separate awareness prompts from decision and purchase prompts because their commercial meaning differs.
Review the prompt log daily for persistent changes, then review pipeline and account progression weekly. Review attribution quality monthly. A score is a dated snapshot. A series of daily observations shows whether movement held long enough to matter.
Sona AI Visibility supports this revenue view by placing citations, AI-referred activity, and commercial outcomes on an account timeline. The useful question is whether the same accounts that encounter AI answers later enter pipeline and close.
Why do AI visibility numbers fail to match revenue, and how do you recover?
AI visibility numbers fail to match revenue when the prompt cohort is biased, answers are personalized, models change, CRM linkage is incomplete, or correlation is mistaken for causation. Visibility is not revenue, so AI measurement needs recovery rules rather than a single dashboard score.
- Sampling bias: Replace generic prompts with real buyer questions from discovery calls, search queries and sales objections.
- Model volatility: Re-freeze the cohort, run prompts daily and report ranges rather than single observations.
- Attribution gaps: Pass AI referrals into GA4 and the CRM, then add AI discovery to intake forms.
- Weak account matching: Audit source fields, contact-to-account rules and opportunity association.
- False causation: Use a holdout or controlled test before claiming content or citation changes produced pipeline.
Monitoring which AI answers mention a brand is only half the job. The other half is connecting those mentions to accounts, pipeline, and revenue. Sona AI Visibility connects citations and AI-referred visits to pipeline and revenue.
Recovery should end with a cleaner measurement design: a stable cohort, repeated runs, explicit discovery capture, and a comparison group. If pipeline rises with no visible cause, inspect hidden referral loss and self-reported attribution. If visibility rises without pipeline, reassess prompt quality and buying-stage relevance.
Frequently asked questions about connecting AI visibility to revenue
Can AI visibility improvements be tied directly to revenue?
Only partly. A mention or citation does not prove a purchase. Link AI-referred visits and self-reported discovery to CRM accounts, opportunities, and closed revenue, then report influenced pipeline until a holdout test supports a stronger causal claim.
What is the difference between AI share of voice and AI referral traffic?
AI share of voice measures how often a brand appears across a fixed prompt set. AI referral traffic measures visits that arrive after AI-assisted research. Share of voice is a leading indicator. Referral traffic bridges AI research, CRM accounts, and commercial outcomes.
Do you need GA4 and a CRM to attribute revenue to AI visibility?
Yes, in practice. GA4 captures AI referrals and conversion events. The CRM holds opportunities, pipeline, and closed revenue. A BI layer or integrated measurement platform joins the records. Add an intake question because some AI research produces no referrer click.
How many prompts should a team track?
Track enough prompts to cover every buying stage, use case, industry, and competitor set with real buyer questions. Prompt count alone is a poor proxy for coverage. Engine breadth, refresh frequency, prompt quality, and commercial relevance matter as much as volume.
Why do AI answers change between runs, and does that break measurement?
Answers vary by model, date, location, wording, retrieval index, and personalization. Measurement still works when the prompt cohort is fixed, runs happen daily, and results are reported as ranges. Repeated observations distinguish durable movement from a one-day anomaly.
Does the method differ for B2B SaaS and B2C ecommerce?
The steps are the same, but the attribution model changes. B2B SaaS has longer sales cycles and buying committees, so account-level CRM linkage and influenced pipeline matter most. B2C ecommerce has shorter paths, so direct purchase attribution, product views, and order value carry more weight.
Summarize this article with AI: ChatGPT · Claude · Perplexity · Google AI Mode
Last updated: October 2026